Counting filtered rows in Excel can be a useful tool when working with large data sets. It allows you to quickly determine how many rows meet specific criteria, without having to manually count them. In this blog post, we will show you how to count filtered rows in Excel using the SUBTOTAL function.
Guide How to Count Filtered Rows in Excel
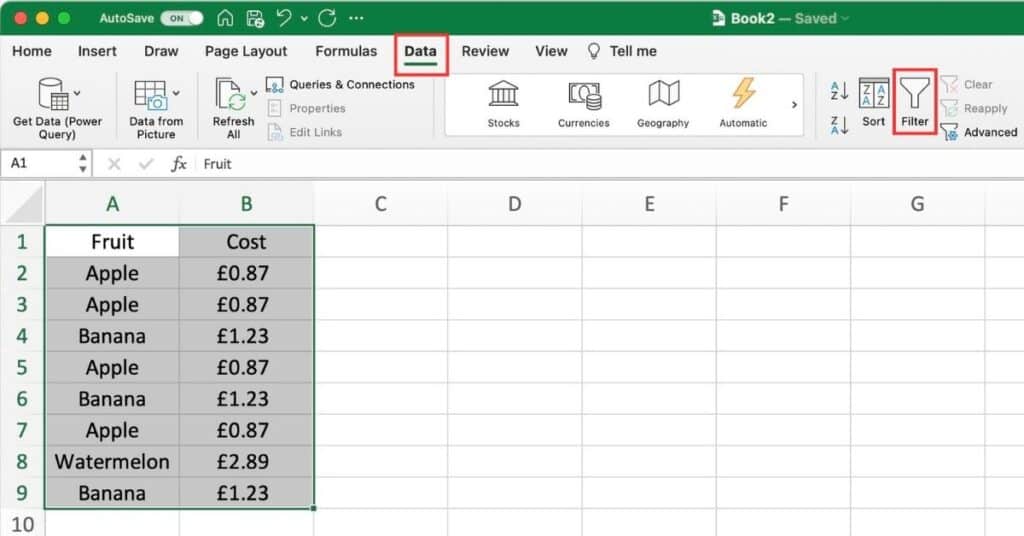
First, select the column in that you want to count the filtered rows.
Click on the “Data” tab in the Excel ribbon, and then click on the “Filter” button to add a filter to your data.

Filter your data by the criteria you want to count.
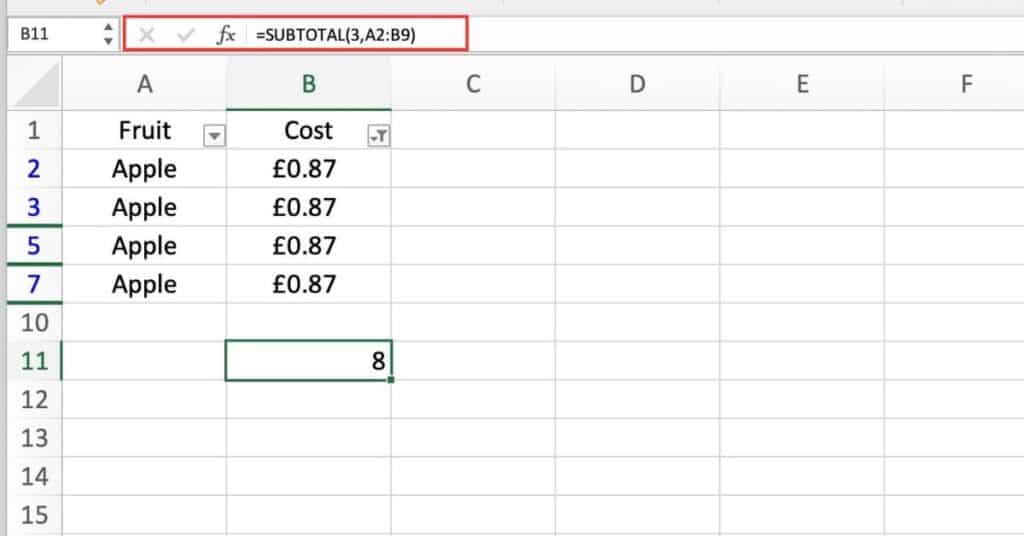
Click on an empty cell where you want to display the count of the filtered rows.
Enter the following formula:
=SUBTOTAL(3,range)Where “range” is the range of cells that you want to count.
Press enter and the count of the filtered rows will be displayed in the cell.

What’s Happening
The SUBTOTAL function is used to calculate the sum, average, count, maximum, and minimum of a range of cells. It can also be used to count only the visible cells in a filtered range.
The “3” in the formula specifies that we want to count the number of cells in the range that contain values.
If we had used “9” instead, it would have counted the number of cells in the range that contain numbers.
By using the SUBTOTAL function instead of the COUNT or COUNTIF functions, we are able to count only the visible cells in a filtered range.
Things to Keep in Mind
When using the SUBTOTAL function, make sure to include the correct argument number for the function you want to use. In this case, we used “3” to count the number of cells with values.
Be sure to include only the range of cells that you want to count in the Excel formula. Including extra cells may give you an incorrect count.
Remember to apply filters to your data before using the SUBTOTAL function to count filtered rows. If you count rows without filtering, you will get the total number of rows in the selected range, not just the filtered ones.
