Excel is a powerful tool that allows users to visualize data in a variety of ways, including through charts and graphs. Creating charts can be a time-consuming process, but fortunately, there is an Excel keyboard shortcut that can make it much quicker and easier. In this post, we’ll focus on how to create an embedded chart using a keyboard shortcut.
Keyboard Shortcut to Create Embedded Chart In Excel
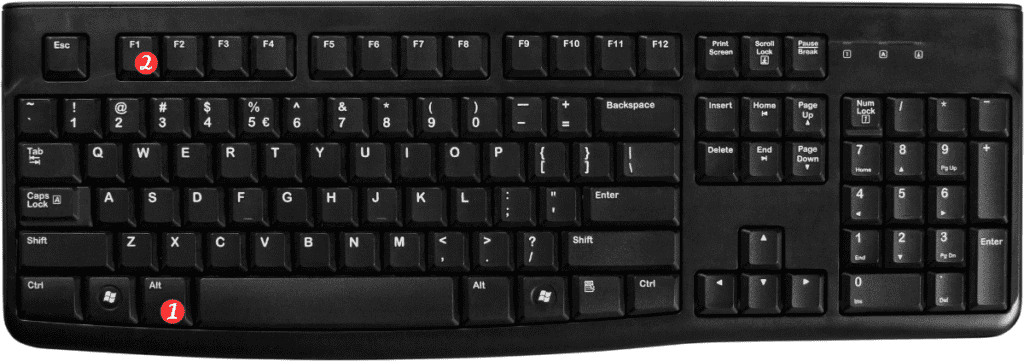
The keyboard shortcut to create an embedded chart in Excel is Alt + F1 for Windows and Fn + Option + F1 for Mac.

Here’s how to use it:
- Select the data you want to include in the chart.
- Press the keyboard shortcut Alt + F1 (Windows) or Fn + Option + F1 (Mac).
- Excel will automatically create an embedded chart on the same worksheet as your data.
That’s it!
By using this keyboard shortcut, you can quickly create an embedded chart. Without having to navigate through Excel’s menus and dialog boxes.
Here are a few points to keep in mind when using this keyboard shortcut:
- The keyboard shortcut will create a chart with default settings. If you want to customize the chart’s appearance or type, you’ll need to do so manually.
- This keyboard shortcut only works for creating embedded charts. If you want to create a chart on a separate chart sheet, you’ll need to use a different method.
- You can also use this keyboard shortcut to create a chart from selected data in a PivotTable.
In summary, the keyboard shortcut for creating an embedded chart in Excel is Alt + F1 (Windows) or Fn + Option + F1 (Mac). This shortcut can save you time and make it easier to create charts in Excel. Especially when you’re working with large amounts of data.
