The Status Bar in Excel is a narrow horizontal bar located at the bottom of the program’s window.
It offers a wide range of useful features, such as the ability to switch between different worksheet views like Page Layout and Page Break Preview and to adjust the zoom level of the worksheet.
Additionally, the Status Bar displays key statistical information about selected cells, including the average, count, and sum.
These features make the Status Bar an important and valuable tool for users of all levels, enhancing productivity and efficiency when working with Excel.
Modes on the Status Bar
There are four status modes that you will see on the excel status bar we will explain what each means.
Ready mode
This is the default mode of the Status Bar. It indicates that Excel is ready to receive input from the user. The Ready mode is active when the worksheet is not currently processing any commands or functions, and when the user is not entering any data into a cell.
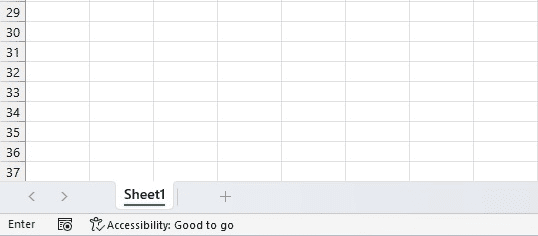
Enter mode
Enter mode is a temporary mode that Excel enters when the user is typing data into a cell. It indicates that the worksheet is waiting for the user to finish entering data into the cell.
Once the user has finished entering the data, Excel returns to Ready mode.
Edit mode
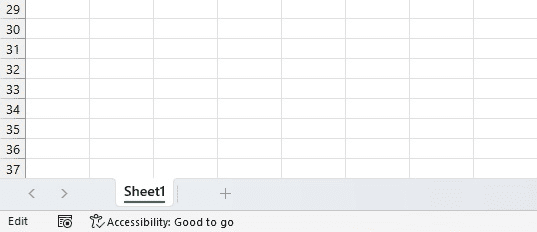
Edit mode is active when the user is editing the contents of a cell. It indicates that the cell is currently selected and the cursor is located within the cell, allowing the user to modify its contents.
Point mode
Point mode is active when the user is navigating through the worksheet. It indicates that the cursor is not located within a cell and that the user is simply pointing to different cells to select or modify them.
The Point mode is also active when the user is using the Fill Handle to copy data or formulas to adjacent cells.
Worksheet Views
By default, every Excel worksheet offers three different options for viewing the data: Normal View, Page Layout View, and Page Break Preview.
These view options can be accessed by clicking on the three buttons located at the bottom right corner of the worksheet.
Each view provides a different perspective on the worksheet.
Allowing users to customize their viewing experience based on their needs and preferences.

Normal view
Normal view is the default view for Excel worksheets. It displays the worksheet without any page breaks or margins, making it easy to view and edit data.
Normal view is best used for entering and editing data, formatting cells, and performing general data analysis.
Page Layout view
Page Layout view provides a more accurate representation of how the worksheet will look when printed.
It displays the worksheet with margins, page breaks, and other formatting options. Allowing users to preview how the data will be displayed when printed.
This view is useful for finalizing the formatting and layout of the worksheet before printing or sharing.
Page Break Preview
Page Break Preview allows users to see how the worksheet is divided into pages when printed. It displays the worksheet with page breaks, showing users exactly where each page begins and ends.
This view is useful for adjusting page breaks and formatting to ensure that the worksheet prints correctly. Page Break Preview is also helpful for identifying and correcting printing issues before printing the worksheet.
Zoom Slider and Percentage
Well, the Zoom Slider is quite a handy feature for Excel users, don’t you think?
You can find it on the right-hand side of the Status Bar, where you’ll see two little buttons, one with a (-) sign and the other with a (+) sign.
These buttons allow you to zoom in and out of your worksheet, so you can easily adjust the size of the data you’re viewing.

When you need to shrink things down a bit, just click on the zoom-out button.
And if you need to get a closer look at something, the zoom-in button is your go-to.
But that’s not all – the Zoom Slider also lets you adjust the visibility of your page by sliding the zoom key in either direction.
With just a click, you can increase or decrease the visibility by 10%, or use the zoom-in and zoom-out options to make more precise adjustments.
All in all, the Zoom Slider is a must-have tool for anyone who wants to make the most of their Excel experience!
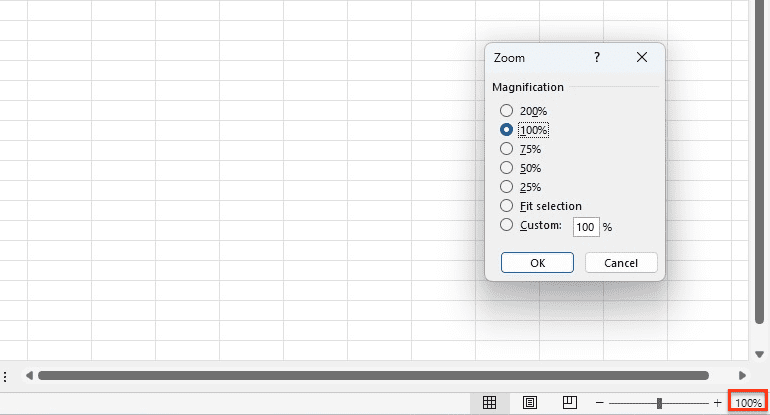
When using Excel, you may have noticed the Zoom Percentage option – this is essentially the same as the Zoom Slider we just discussed.
Next to the Zoom Slider, you’ll see a button that can be clicked to access the Zoom dialog box.
From there, you can set the magnification percentage for your current worksheet to whatever you like.
Customizing the Status Bar
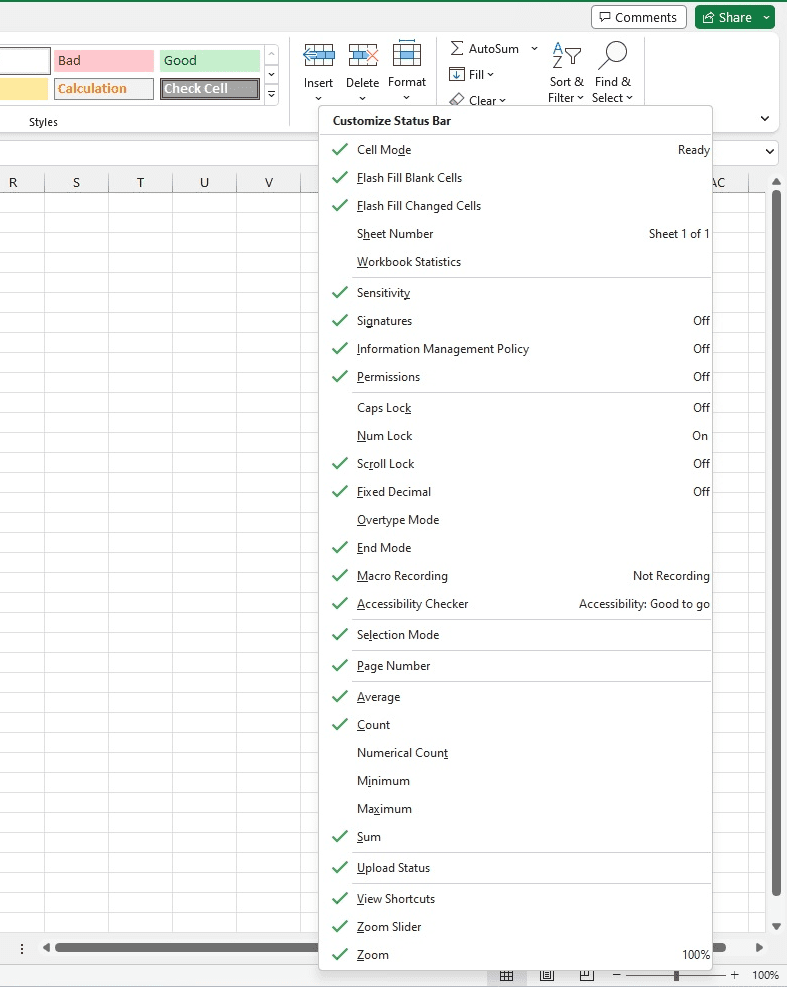
To Customizing the Status Bar to add or remove things is super easy.
- Right click anywhere on the status bar
- Select any mode you want to add
- A tick next to the mode will appear
- To remove a mode click it to remove the tick
Workbook Statistics
Workbook Statistics provide users with valuable information about their Excel workbooks, including the number of sheets, cells, and formulas used, as well as information about how much space each worksheet is taking up.
This can be useful for tracking and analyzing data and making informed decisions about how to organize and optimize your workbook.
To access Workbook Statistics, simply right-click on the status bar and select “Worksheet Statistics” from the drop-down menu.
You’ll then see a dialog box with a variety of information about your workbook. Including the number of sheets, cells, and formulas used.
By using this data, you can gain insights into your data usage and make informed decisions about how to manage and optimize your Excel workbooks.
Caps, Num, and Scroll Lock
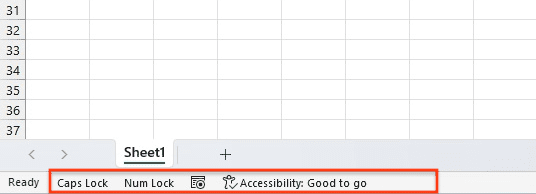
The Caps Lock, Num Lock, and Scroll Lock indicators on the Excel Status Bar. Are designed to provide users with information about the state of these keyboard functions.
The Caps Lock indicator appears on the Status Bar when the Caps Lock function is enabled. This is useful for ensuring that you’re not inadvertently typing in all caps when you don’t mean to.
The Num Lock indicator appears when the Num Lock function is enabled. This is useful for those who frequently use the numeric keypad on their keyboards.
The Scroll Lock indicator appears when the Scroll Lock function is enabled. This is a less commonly used function, but it can be useful for those working with large data sets in Excel.
By providing users with clear indicators of the state of these keyboard functions.
The Excel Status Bar helps to ensure that users are working efficiently and effectively in their workbooks.
Page Number
The Page Number is an important feature in Excel that allows users to keep track of where they are in their worksheets.
By displaying the page number on the Status Bar, users can quickly and easily see which page they are currently viewing.
Statistical/Mathematical Options
The Status Bar in Excel provides a variety of statistical and mathematical options to help users quickly analyze their data.
Here’s a brief explanation of some of the most commonly used options:
- Average: This option calculates the average value of the selected cells.
- Count: This option counts the number of cells in the selected range that contain numeric values.
- Numerical Count: This option counts the number of cells in the selected range that contain any type of data, including text and blank cells.
- Sum: This option adds up the values of the selected cells.
- Minimum: This option returns the smallest value in the selected range.
- Maximum: This option returns the largest value in the selected range.
These options can be incredibly helpful when analyzing large sets of data or when trying to quickly summarize a worksheet.
To use these options, simply select the cells that you want to analyze. The results will appear on the Status Bar at the bottom of the Excel window.
While the Status Bar in Excel is easily overlooked yet it offers a wealth of information. If you are just starting to learn Excel the status bar shouldn’t be overlooked.
